OpenCollBench - Benchmarking of Collision Detection & Proximity Queries as a Web-Service
We present a server-based benchmark that enables a fair analysis of different collision detection & proximity query algorithms. A simple yet interactive web interface allows both expert and non-expert users to easily evaluate different collision detection algorithms' performance in standardized or optionally user-definable scenarios and identify possible bottlenecks. In contrast to typically used simple charts or histograms to show the results, we additionally propose a heatmap visualization directly on the benchmarked objects that allows the identification of critical regions on a sub-object level. An anonymous login system, in combination with a server-side scheduling algorithm, guarantees security as well as the reproducibility and comparability of the results. This makes our benchmark useful for end-users who want to choose the optimal collision detection method or optimize their objects with respect to collision detection but also for researchers who want to compare their new algorithms with existing solutions.
Publications
Files:
Talks:
- TransAIR Conference 2020: Democratize AI with open research
Heatmap Visualization
The benchmarking suite by Trenkel et al. already includes several scripts based on Gnuplot to generate plots of the results: for instance, for a pair of objects at a certain polygon count, it can plot the average or maximum running time of the benchmarked algorithms with respect to the distance, or it can plot the running-time with respect to polygon count for a fixed distance. Such plots are useful to get a broad overview of the algorithms' performance with a particular pair of objects.
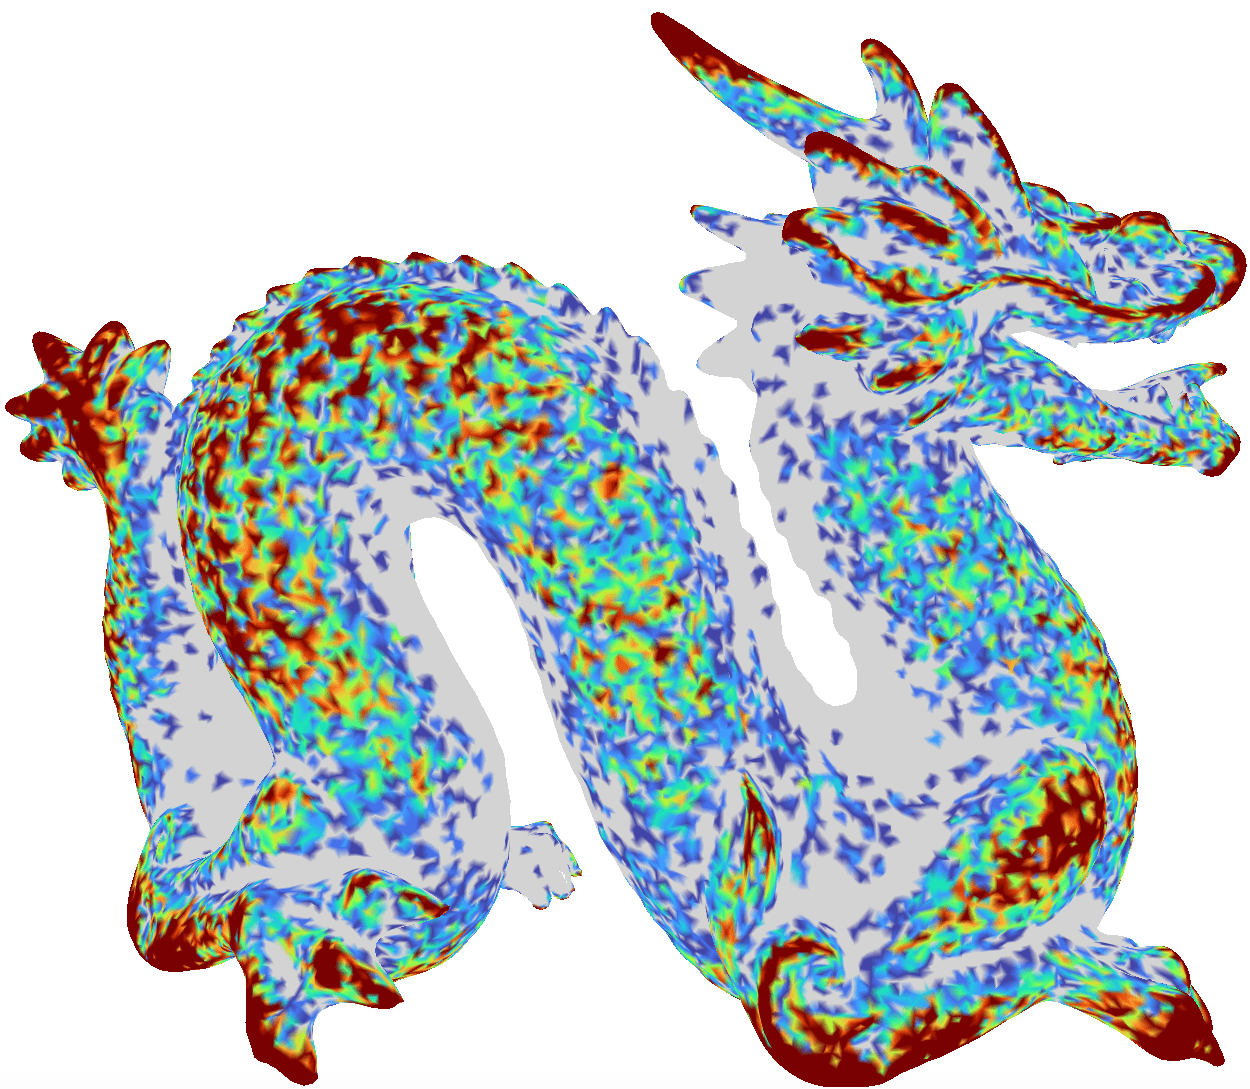
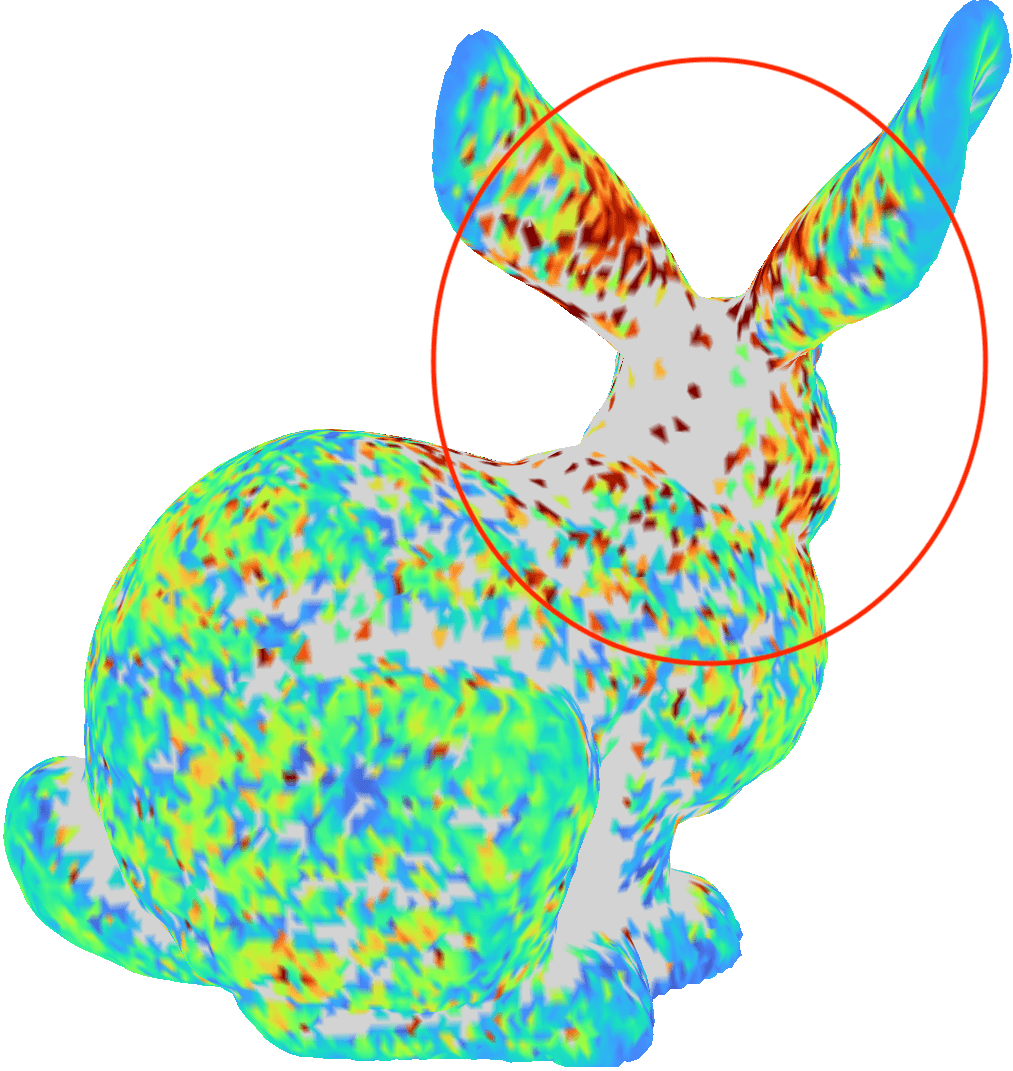
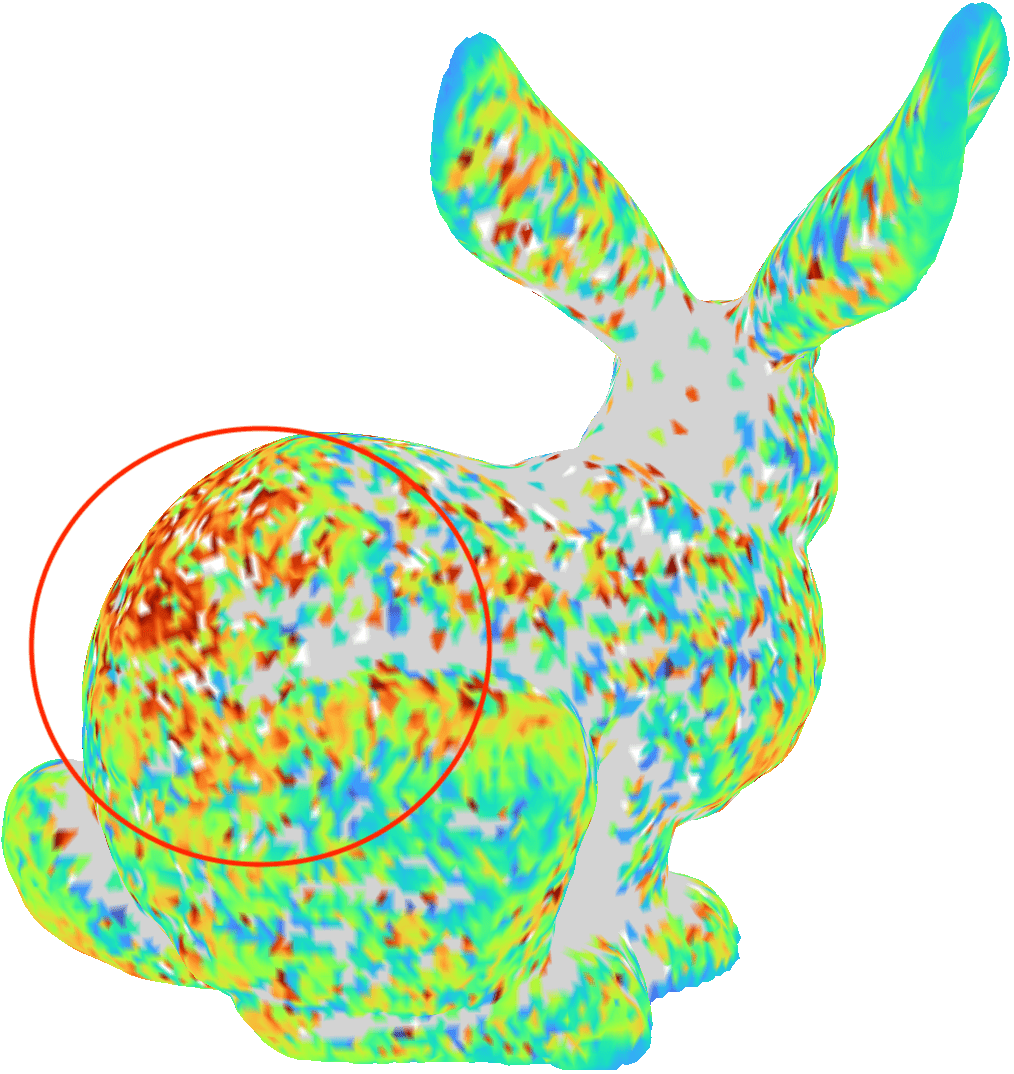
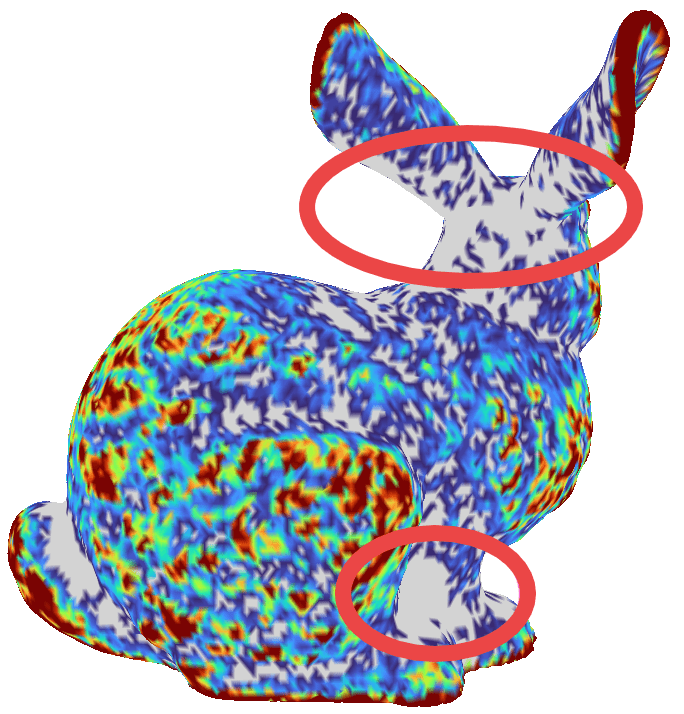
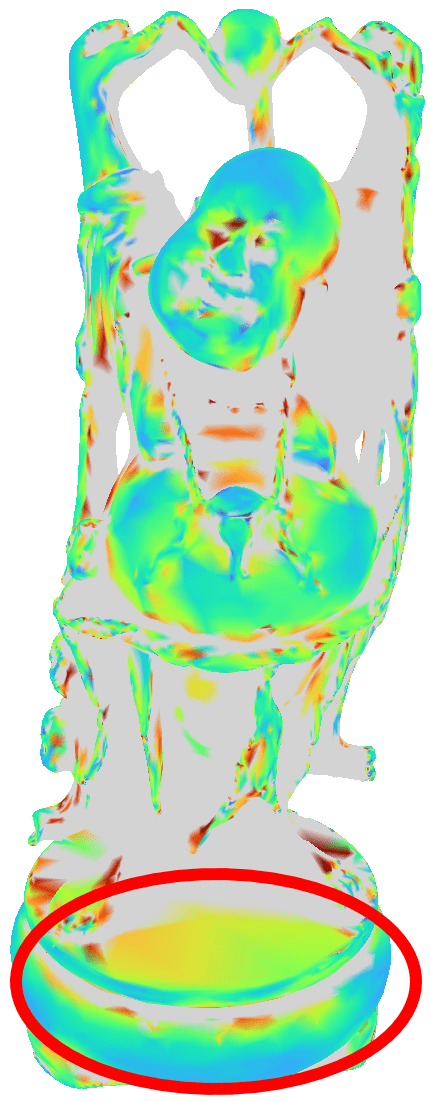
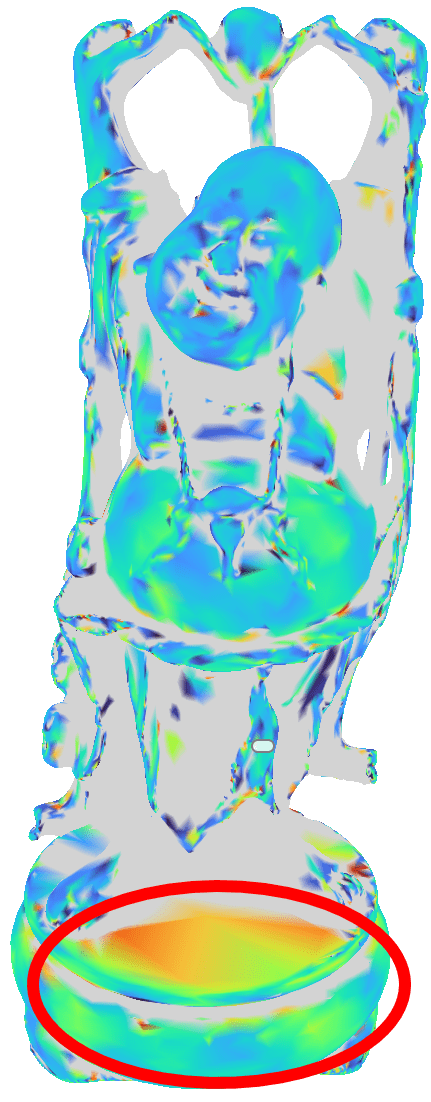
However, depending on the object, it is possible, that the maximum running time is realized only at a very special part of the object that is hardly colliding in the target application. Even more, maybe a slight change of the object, e.g., placing an antenna a few polygons to the right or the left, might change the performance of the collision detection dramatically, so can also do a simple re-polygonization of parts of the object. Consequently, we decided to implement a novel, more sophisticated visualization of the benchmarking results on a sub-object level. The main idea is to visualize different results directly on the object's surface by using a heatmap.
To do that, we collect additional data, as written in the previous section, during the benchmark. For a pair of 3D objects A and B and a set C of n configurations C = (c1, c2,...,cm) that was generated by the benchmarking suite, we store for each configuration ci in C the collision check time ti, the number of tested bounding volumes bvi, the number of tested polygons ni. Then we project the data to the object to generate the heatmap. Therefore, we compute for each configuration ci the closest point pi between the pair of objects. This is usually located on a polygon p of A and one B. In order to generate a heatmap for A we assign the measured values ti, bvi, and ni to all vertices of p. Obviously, we normalize the assigned vertex values by dividing them by the number of assignments.
This facilitates it to identify interesting object regions, e.g., regions that are hardly checked for collisions, regions where particular algorithms perform better or worse, etc. These vertex values can be easily mapped to color values when showing the heatmaps in our web GUI. We support different mappings of the values to colors, namely:
- Average, median, min, and max timing to visualize critical regions based on algorithm's timing.
- Standard Deviation and Median Absolute Deviation to visualize outlier regions where algorithm's timing could differs greatly between slightly different configurations.
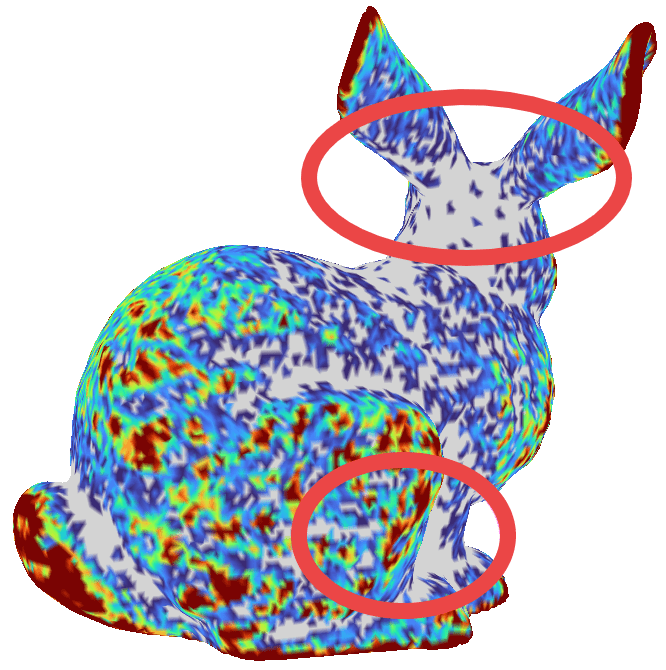
- Configuration density to visualize regions that are extensively or hardly checked by algorithms.
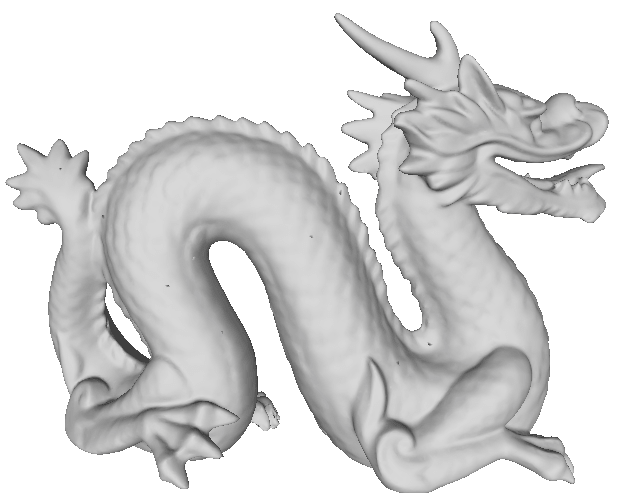
(a) 3D object
|
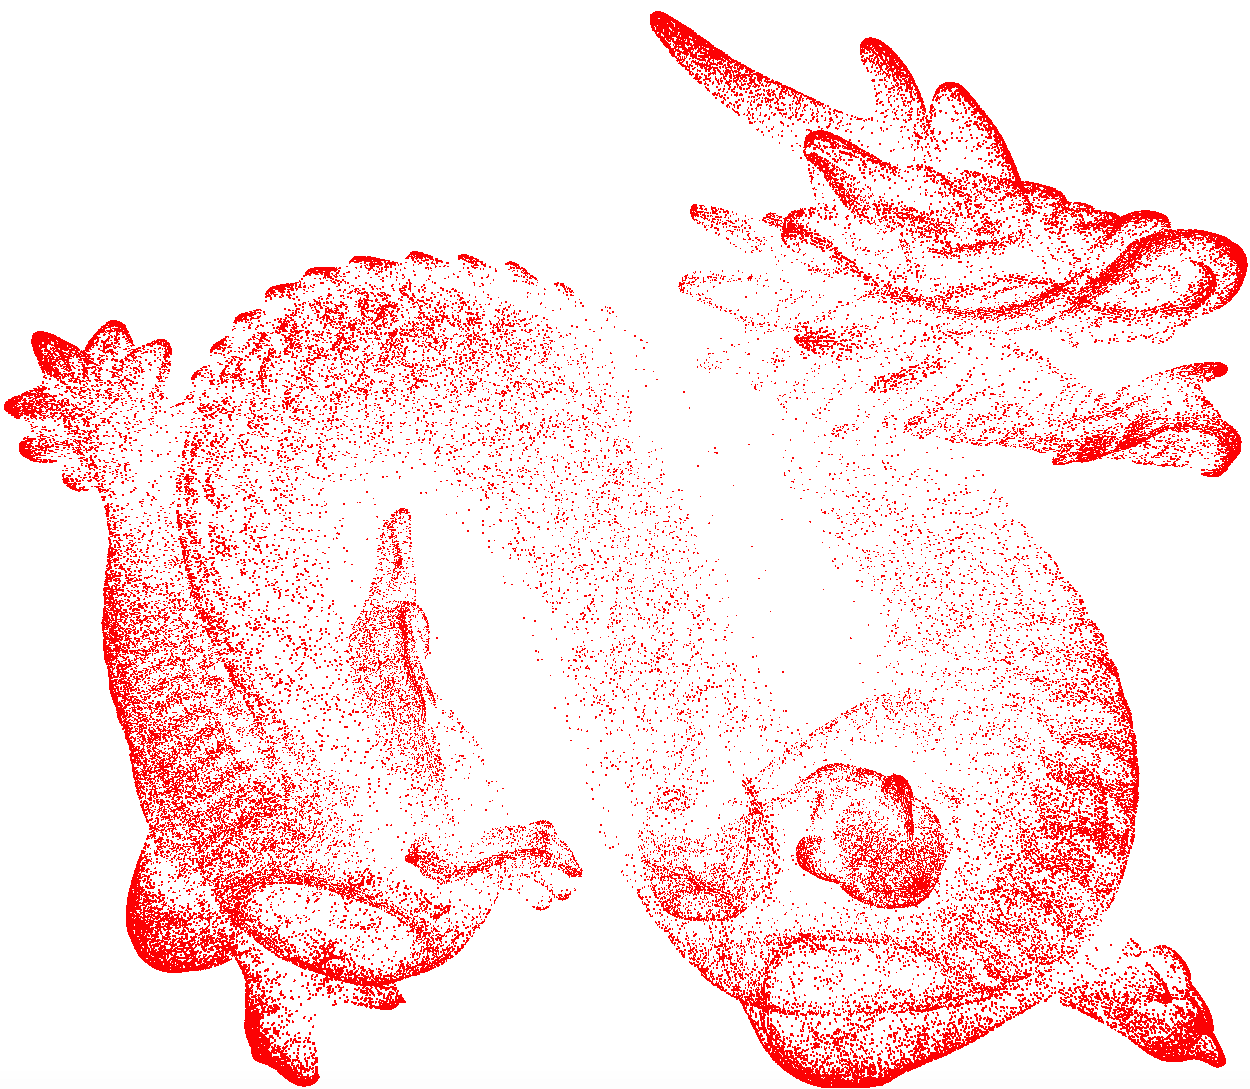
(b) closest points of all configurations
|
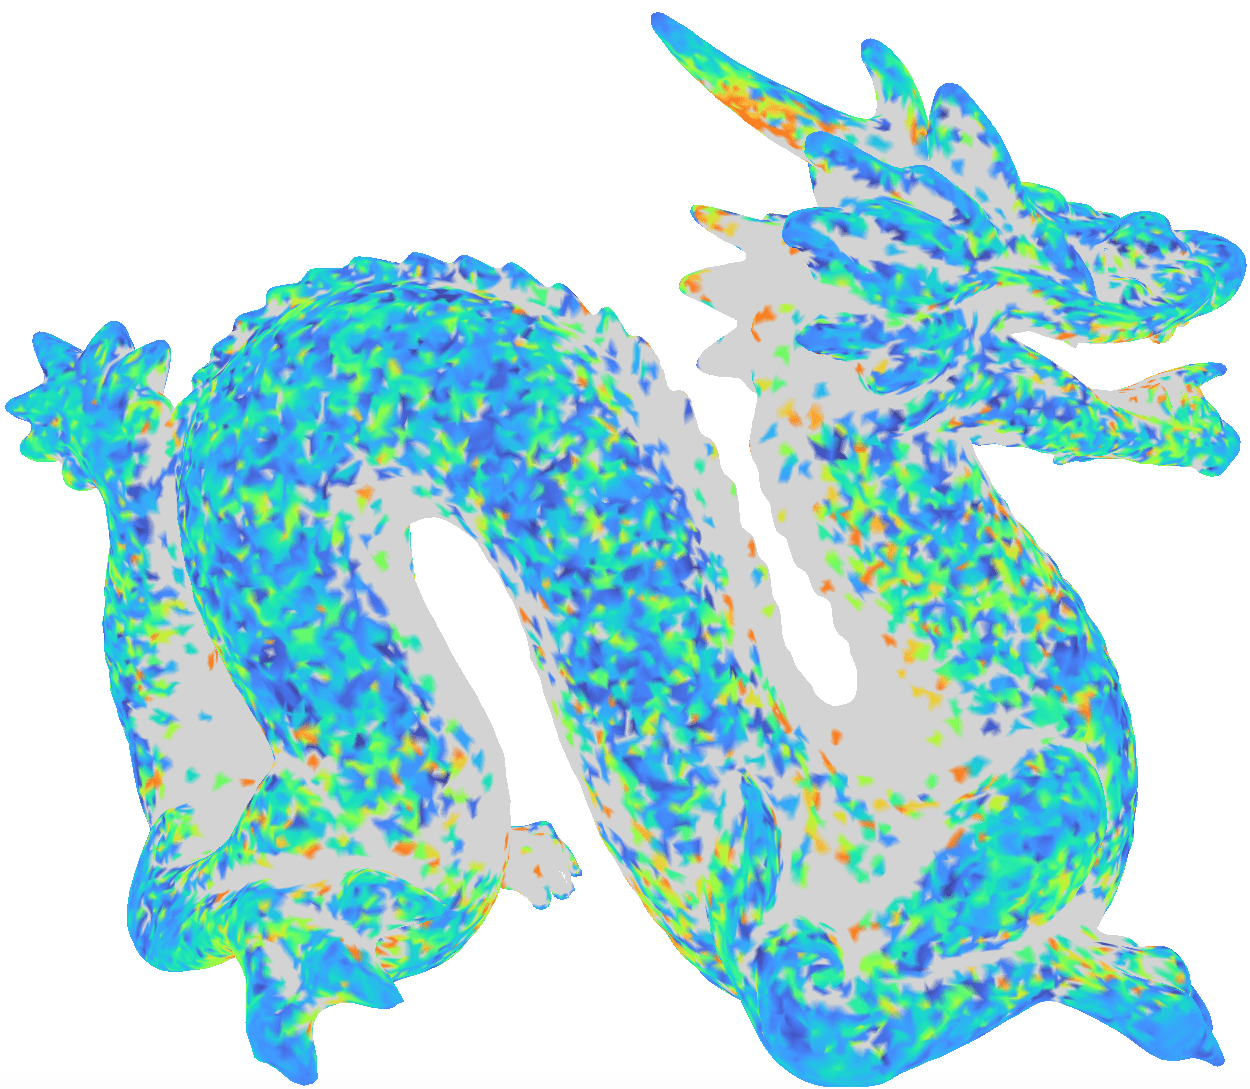
(c) heatmap based on timings
|
(d) heatmap based on density
|
The picture above shows our heatmap generation pipeline. (a) shows the 3D object to benchmark, (b) closest poinst of all configurations, (c) generated heatmap based on algorithm's timings, and (d) generated heatmap based configuration's density. For further details about the configuration generation algorithms we used in our benchmarking suite, we refer the interested user to our Web3D Paper.
Web-based Benchmarking Service
A primary goal of OpenCollBench as a benchmark as a service is to simplify the time-consuming process of integrating CD and configuring algorithms and to provide a common hard- and software platform to produce long-term reproducible and comparable results. We have realized this by a web-based client-server architecture. Figure below shows an overview of our system; it is based on a front end that provides an easy-to-use GUI to the user and a dedicated back end server that performs the actual benchmarking.
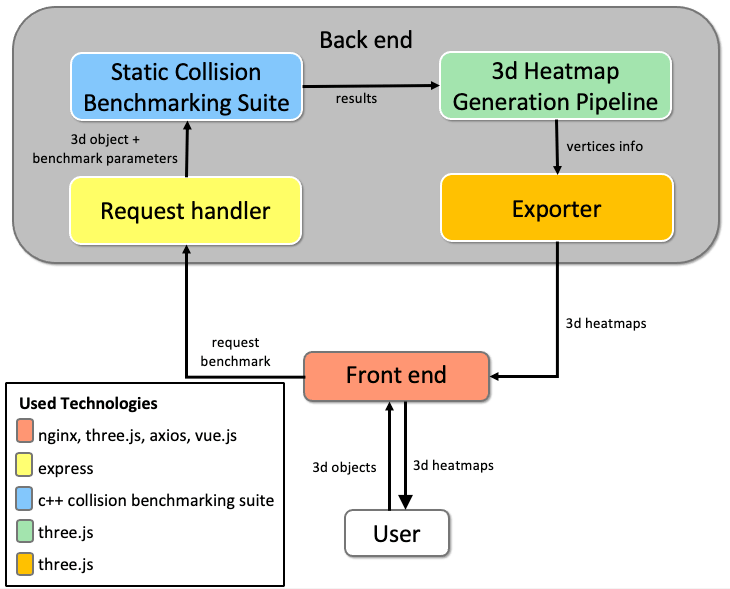
System Overview
|
The front end is designed to focus on simplification and usability of the benchmarking process to enable both expert and non-expert users to intuitively benchmark CD algorithms. We have implemented our front end using the vue.js framework. Figure (a) below shows the website to select appropriate benchmark parameters via sliders and buttons. Additionally, it is possible to upload objects and optionally store them together with the generated configurations. Another option is to register for an account to recall previous benchmarking results or re-trigger past benchmark runs. In order to prevent failed benchmark due to connection problem or time constraints, we mark incoming benchmark requests with a unique id and store the id to the user's browser locally via cookies. This request-id enables the user to resume ongoing benchmarks. We also implemented a progress interface (see Figure (b) below) to keep the user informed about ongoing benchmark, e.g., uploading objects, generating configuration, performing benchmark, or generating heatmaps. By default, all generated results will be saved on our server for a period of time in case the same object is being tested again. However, we plan to add a more sophisticated access system that optionally allows users to secure their uploaded objects and results in the future. This is required, especially for industrial users that wish nondisclosure. Traditional plots of the results of the benchmark can be downloaded. Moreover, our client offers the possibility to inspect the objects with the heatmap overlay discussed in the previous section. The visualization is realized in WebGL via three.js. The heatmap viewer can be adjusted by the user to show the different results, switch outlier removal on and off, or chose an appropriate coloring method (see Figure (c) below).
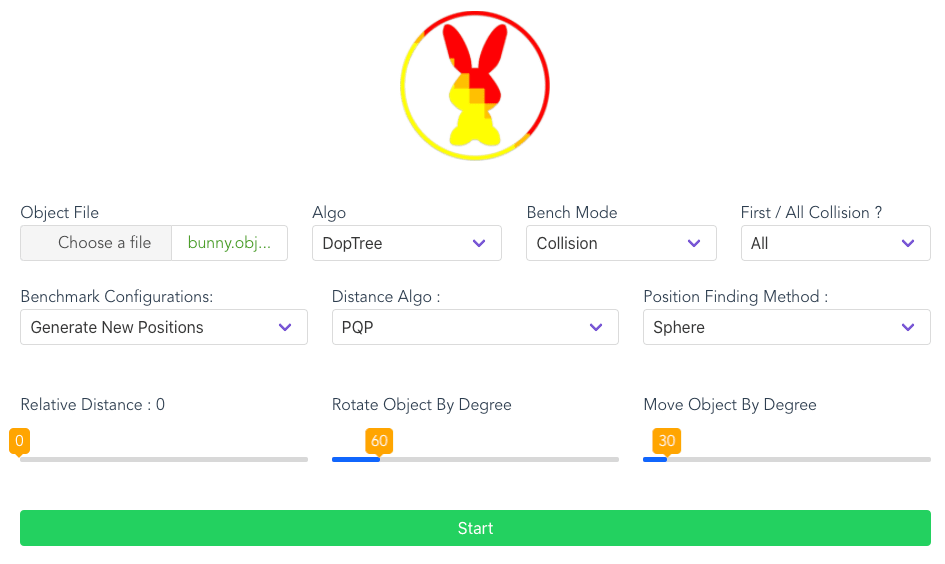
(a) Frontend GUI
|
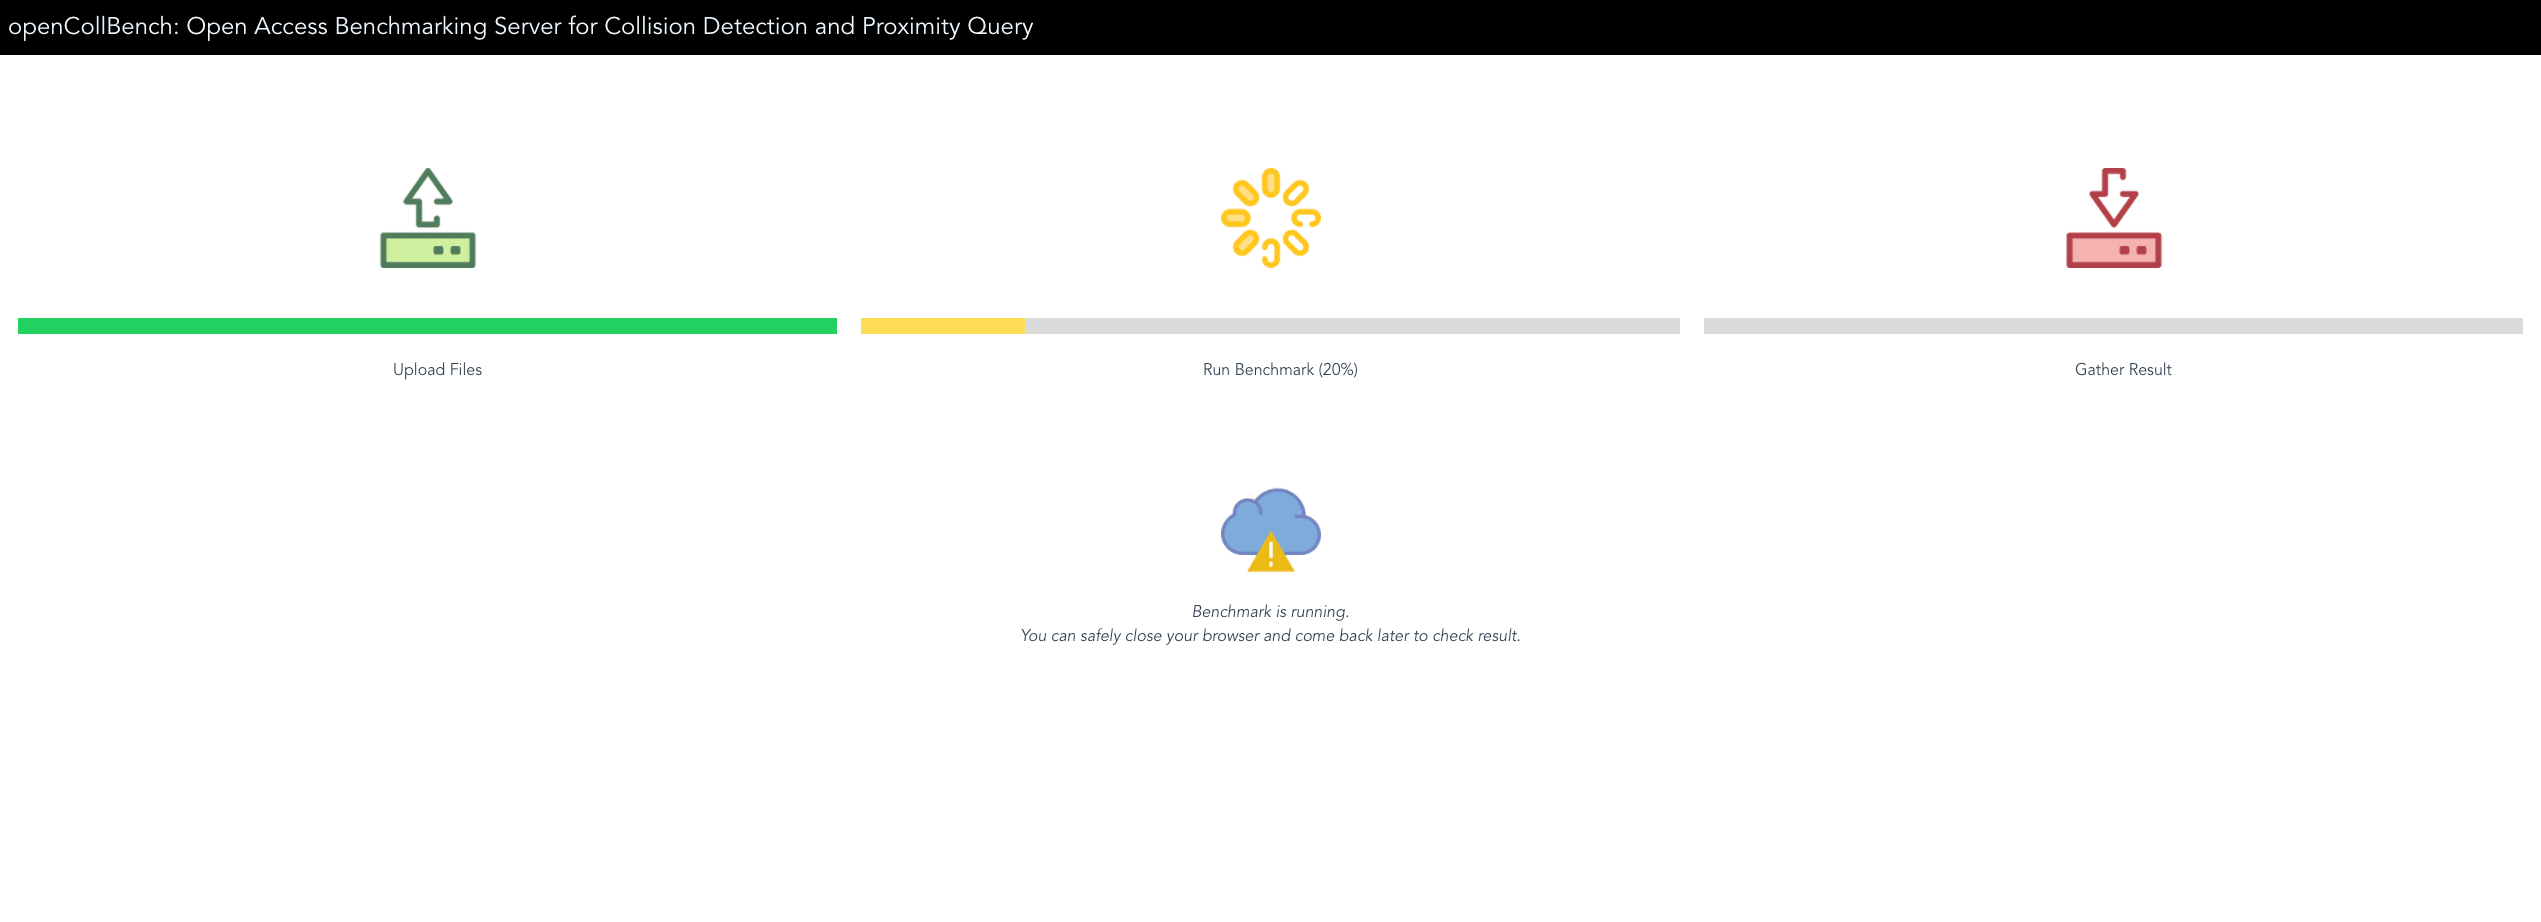
(b) Progress Page
|
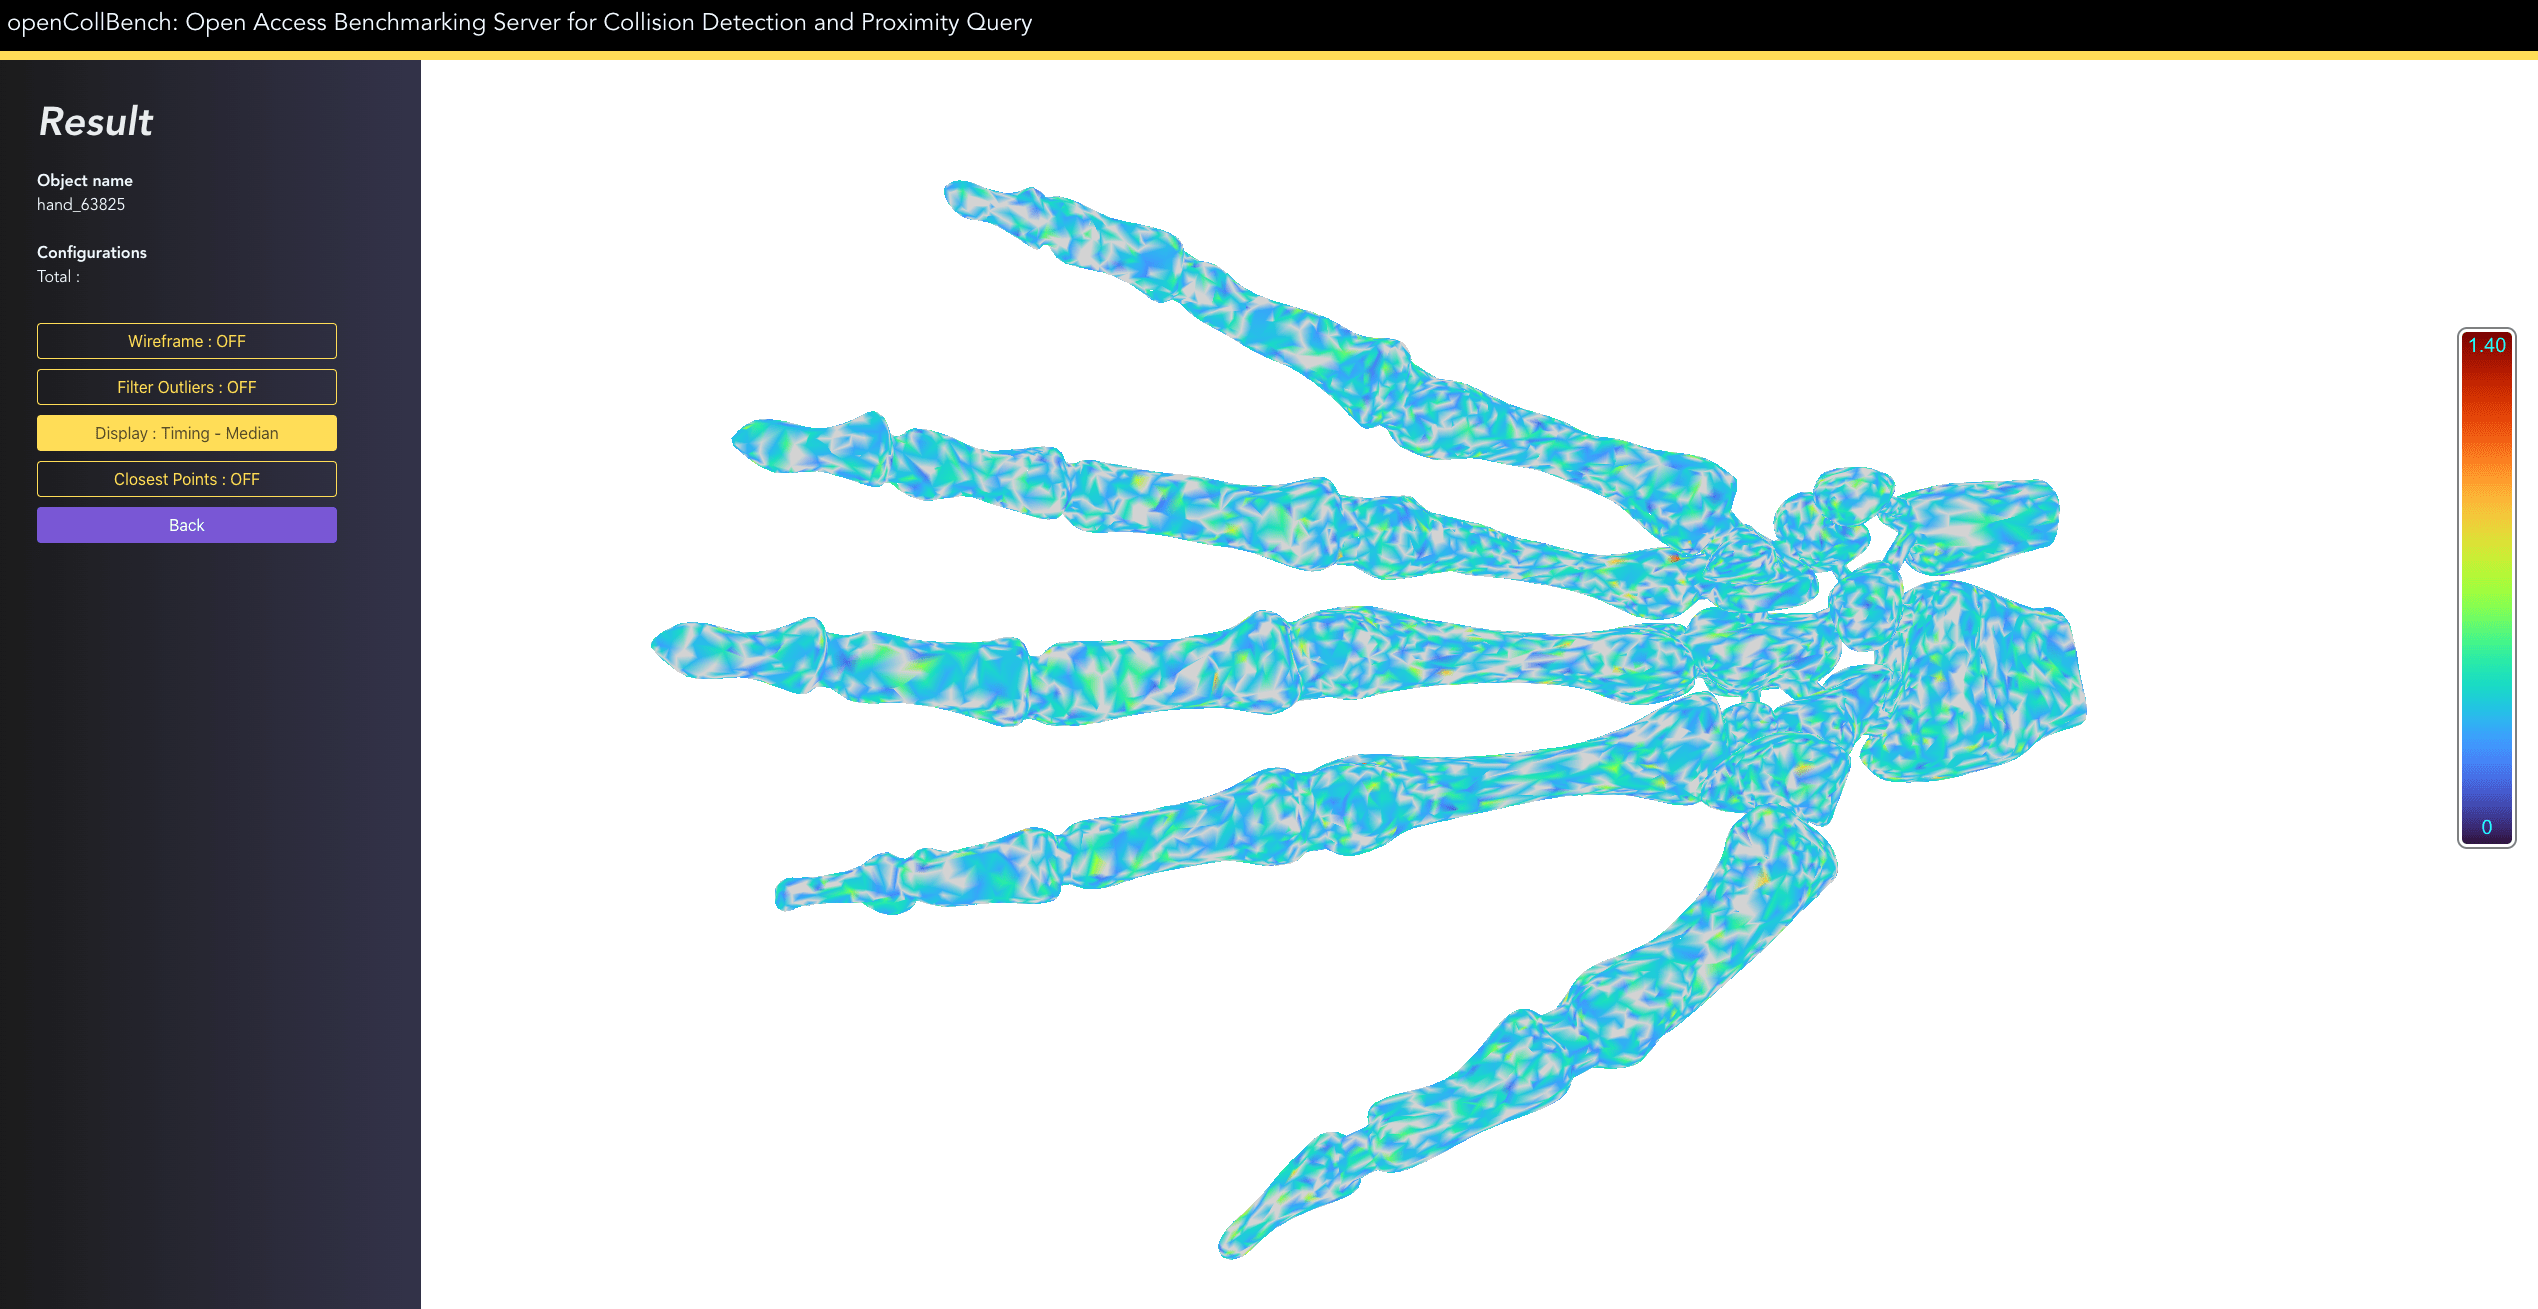
(c) Result Page
|
Features
- Web based Open Benchmark, no installation required
- Automatic heatmap visualization based on algorithm's variables, e.g., timing, bounding volume test, polygon test, and configuration's density
- Automatic heatmap generation using measurement of average, median, minimum, standard deviation, median absolute deviation, and configuration's density
- Heatmap visualization that allows identification of critical regions on a sub-object level
- Automatic and exhaustive generation of configurations
- Preload with popular collision detection & proximity query libraries
- Two different methods for sampling the search space
- Supports OBJ file format. More file format coming soon.
Sample Heatmaps
Heatmap based on algorithm's timings
|
Heatmap based on configuration's density for both grid and sphere method
|
Heatmap based on algorithm's BV & polygon test
|
Supported Collision Detection & Proximity Query Libraries so far
V-CollidePQP
Dop-Tree, BoxTree and SIMDop
If you want to include your own collision detection or proximity query library, feel free to send us your wrapper code, so that we can integrate it to our opencollbench.
License
This original work is copyright by University of Bremen.
Any software of this work is covered by the European Union Public Licence v1.2.
To view a copy of this license, visit
eur-lex.europa.eu.
The Thesis provided above (as PDF file) is licensed under Attribution-NonCommercial-NoDerivatives 4.0 International![]()
![]()
![]()
![]() .
.
Any other assets (3D models, movies, documents, etc.) are covered by the
Creative Commons Attribution-NonCommercial-ShareAlike 4.0 International License.
To view a copy of this license, visit
creativecommons.org.
If you use any of the assets or software to produce a publication,
then you must give credit and put a reference in your publication.
If you would like to use our software in proprietary software,
you can obtain an exception from the above license (aka. dual licensing).
Please contact zach at cs.uni-bremen dot de.