Metaphors for Immersive Software Visualisation
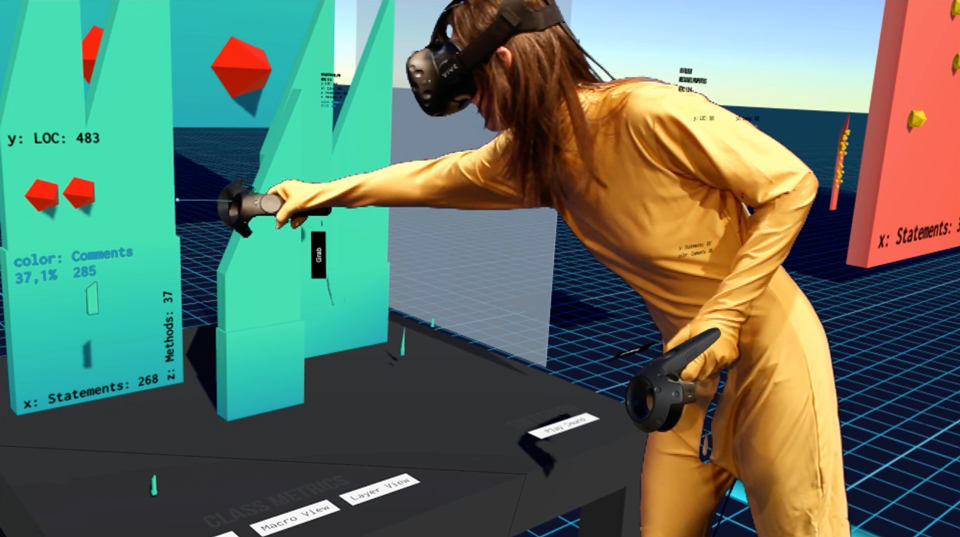
The aim of this thesis was to explore graphical representations for visualising software in virtual reality.
Description
Software is intangible, abstract and complex. To visualise it, metaphors are quite inevitable. The main concern of this thesis was to experiment with graphical representation of code entities and their relations in a room-scale virtual environment. Since this thesis focused mainly on the design issues, it uses methodology for designing VR interfaces “VRID Model” (Tanriverdi&Jacob) as a core concept for modelling virtual environments and designing interaction in VR. The modelled environment (working title “SoftWorld”) is based on the data from a software written in Java at HEC Software Development between 2015 – 2016: 23k lines of code, 325 files and 363 Java classes, 80,6% coverage through 139 unit tests (Snapshot 1.2.3. from 16th July 2016 on which most of the static data visualisation are based). The used data metrics about the system comes from SonarQube, an open source quality management platform, and are imported to Unity3D. The metaphors (as models of VR environment) are implemented in C#, developed in Unity3D version 5.5. to run on HTC Vive.
Results
Final outcome (application demo “SoftWorld”) introduces software in a simplified and playable way, so that different users coming to the code later in its life can understand, memorize and discuss the software structure and its evolution. Created virtual environment has three levels which concentrate on specific questions and goals that motivated the visualisation:
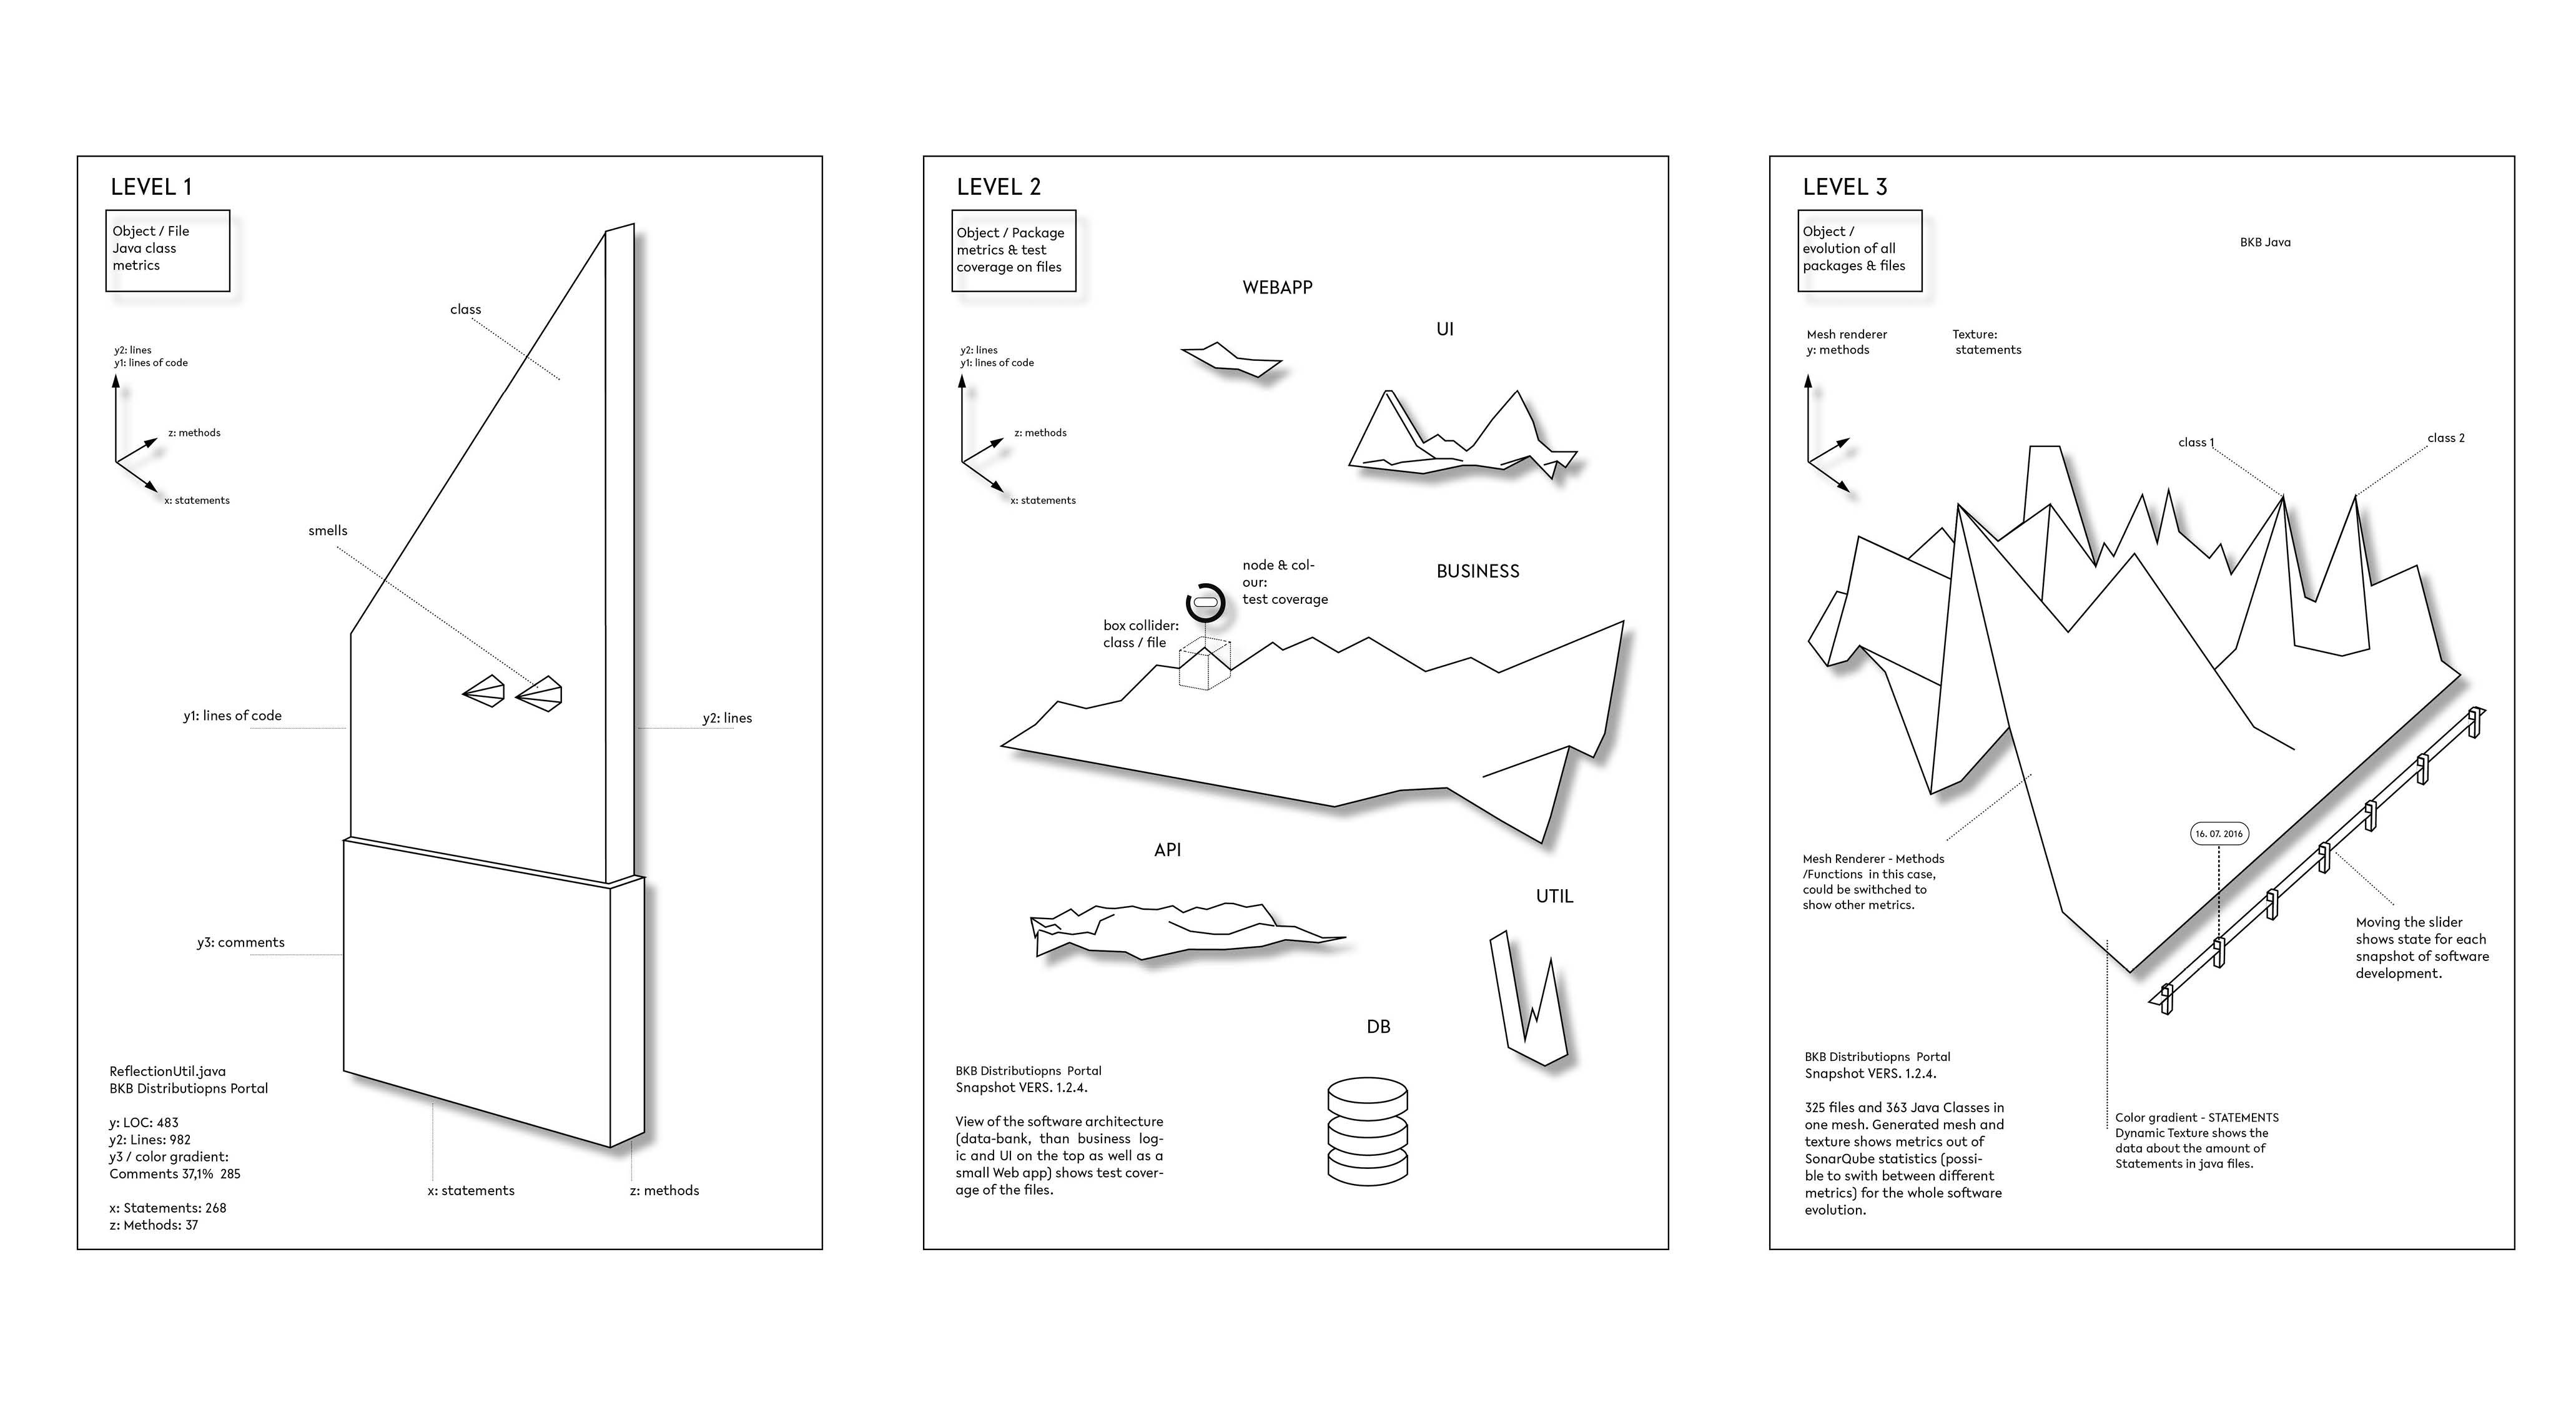
- Level 1: Metaphors for class metrics. Task: to identify anti-patterns.
Q: When, why and by whom was this part of code identified as a potential problem (a.k.a. smell)? How many smells, classes, LOC, statements and methods have a file? - Level 2: Metaphors for software architecture visualisation. Task: to show test coverage.
Q: How many unit tests have been written for each of the packages, how high is the test coverage for each tested file and which files have 0% coverage? - Level 3: Metaphors for software evolution. Task: to visualise the development of the software.
Q: What files have been changed since the previous snapshot, which metrics have been collected on which snapshots and what are the differences between them?
Displaying software defects or problems, exploring unit test coverage or reviewing software evolution are some of the created scenarios which interfaces could be used for a general dissemination and support of programming education. Some of the metaphors, e.g. procedurally generated data meshes (Level 3) displaying the software evolution, could be even used as inspiration for highly specific refactoring purposes. In order to do that a lot more serious and narrowed work would be necessary. SoftWorld as a project has also another level of visualisation, the staging of its presentation in form of “Innovation Show”. In a subtle way, such presentation points out to the cultural techniques of VR and IT work, the techniques of cognitive capitalism – commercialism, playbour (labour as a play) and creative expression.
Files / Links
Master's thesis documentation in form of an artistic research for University of the Arts Bremen.
Research-blog on the topic of software visualisation in 3D and VR datavisualisation.
A movie that shows SoftWorld as a mixed reality demo.
Credits
Master's thesis by Lucia Mendelova
University of the Arts Bremen, Master of Arts in Digital Media (MA) WS 2016/2017.
Supervisors
Prof. Andrea Sick, Prof. Dennis Paul, Prof. Gabriel Zachmann
Collaborations
This work was performed in collaboration with HEC IT Engeneering Bremen .
Photodocumentation
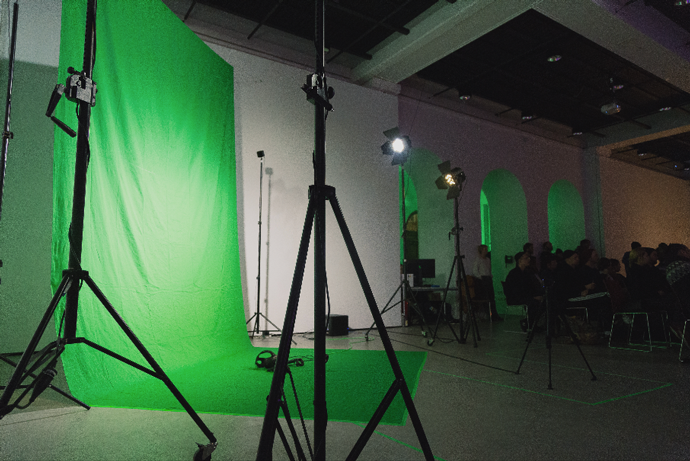
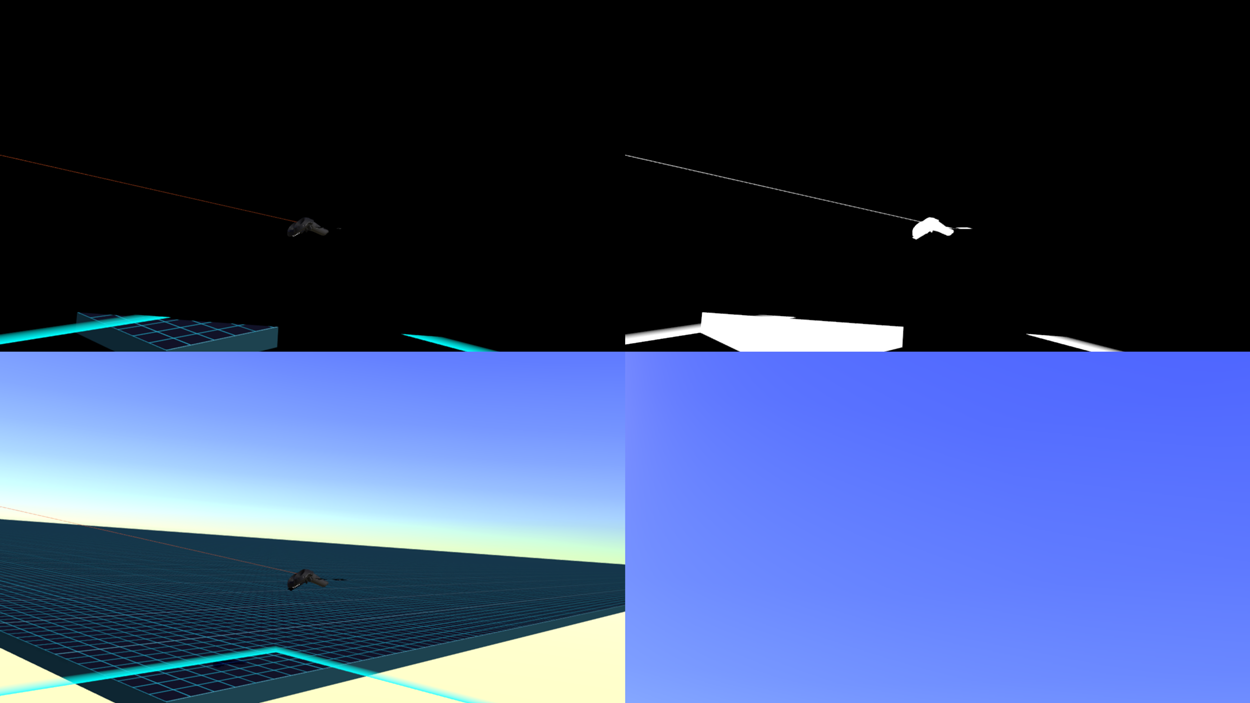
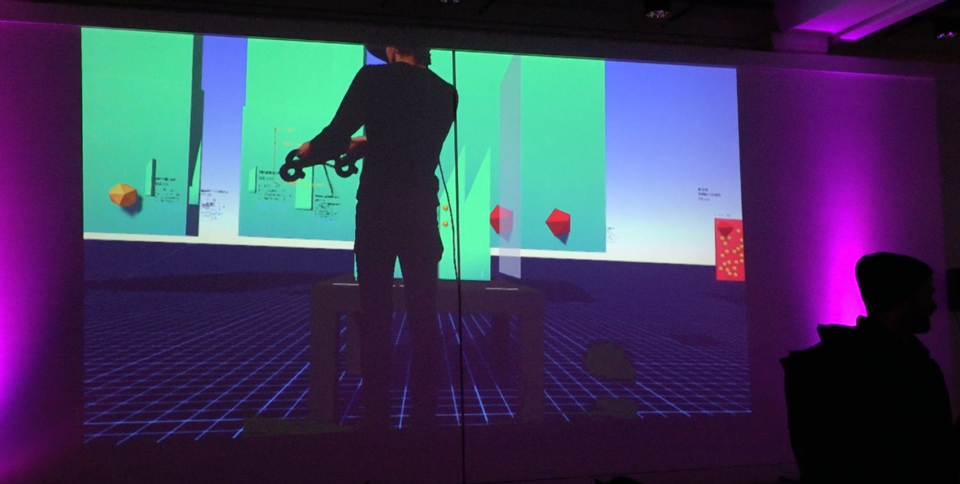
Mixed reality setup, real-time rendering and stitching
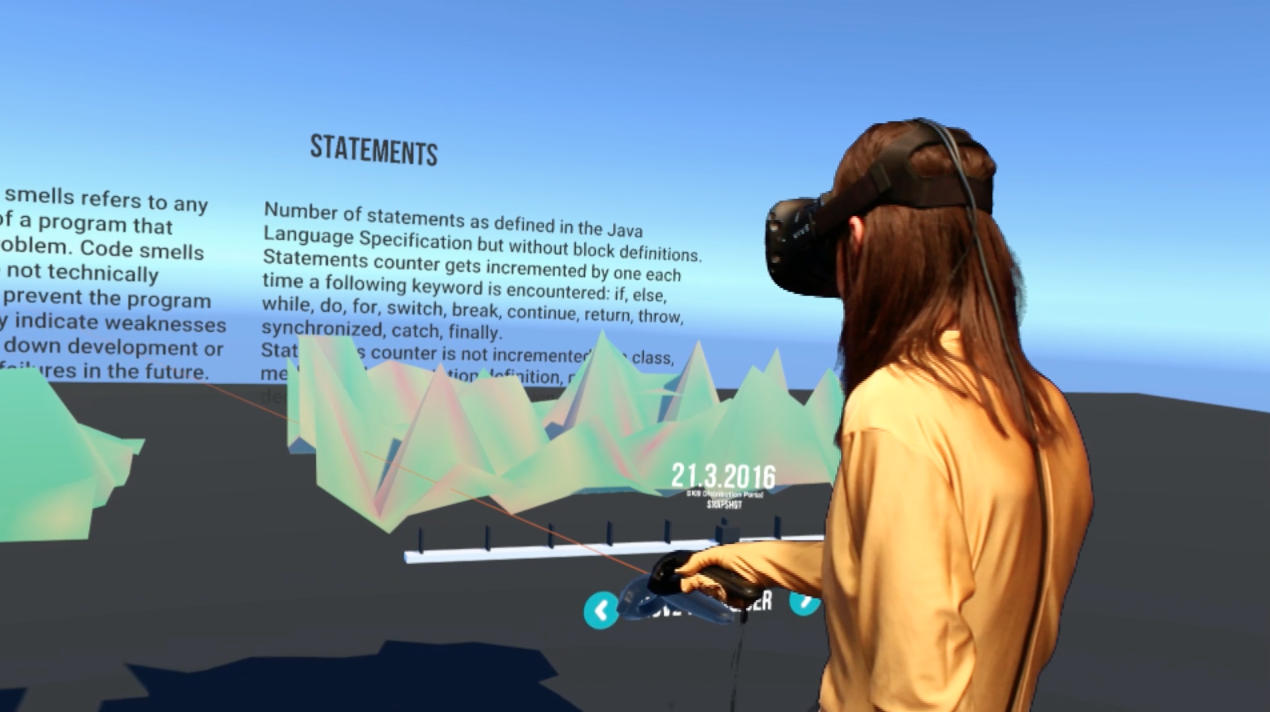
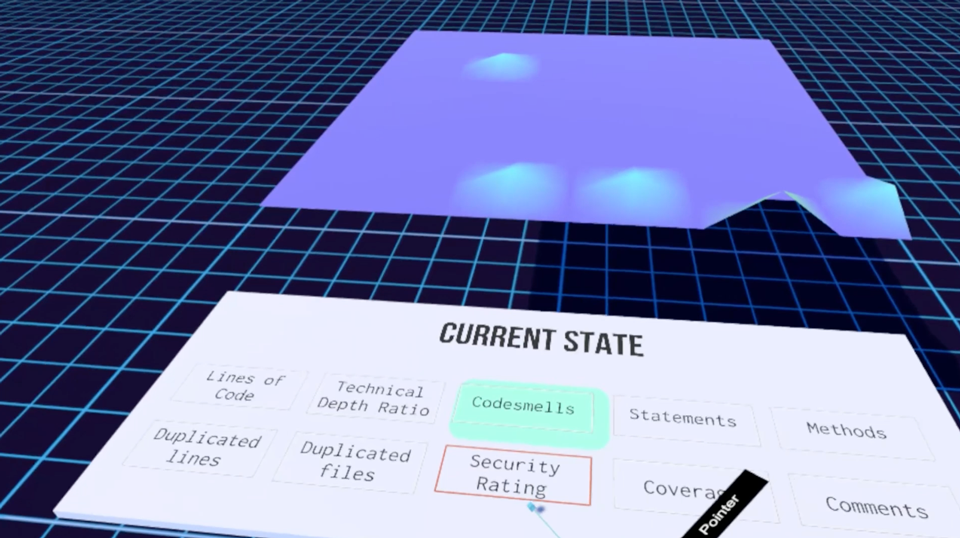
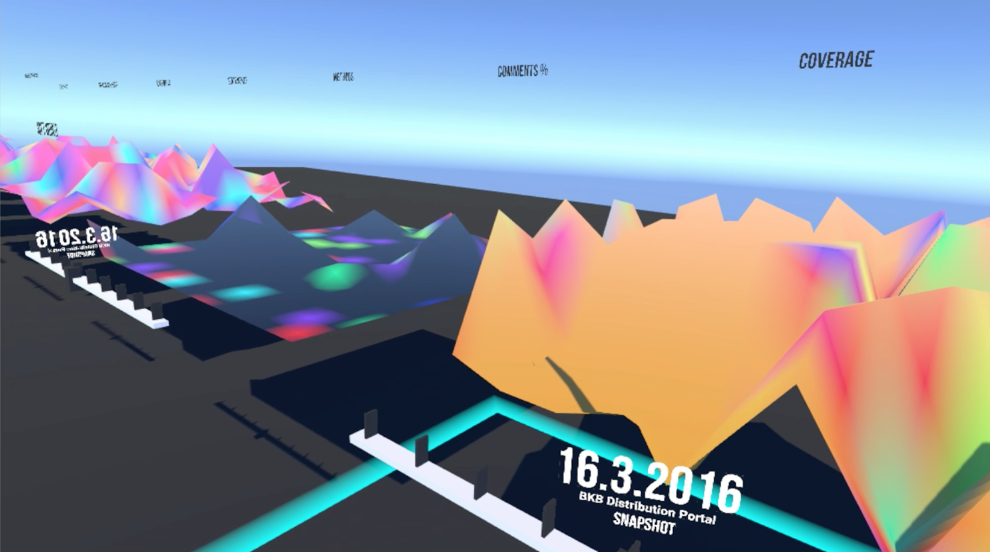
Procedurally generated meshes (vertex mesh and texture) created out of data metrics.
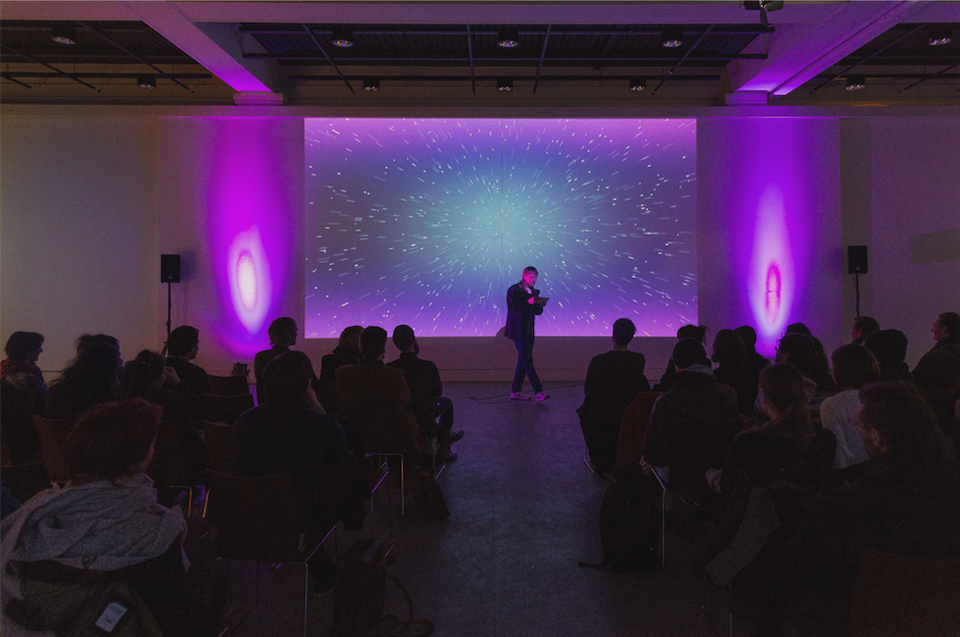
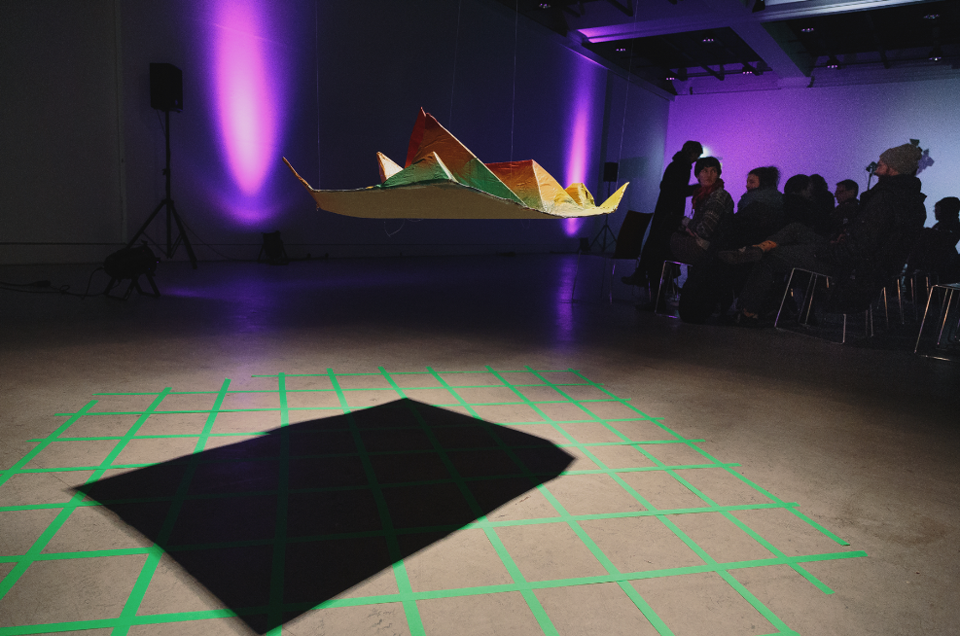
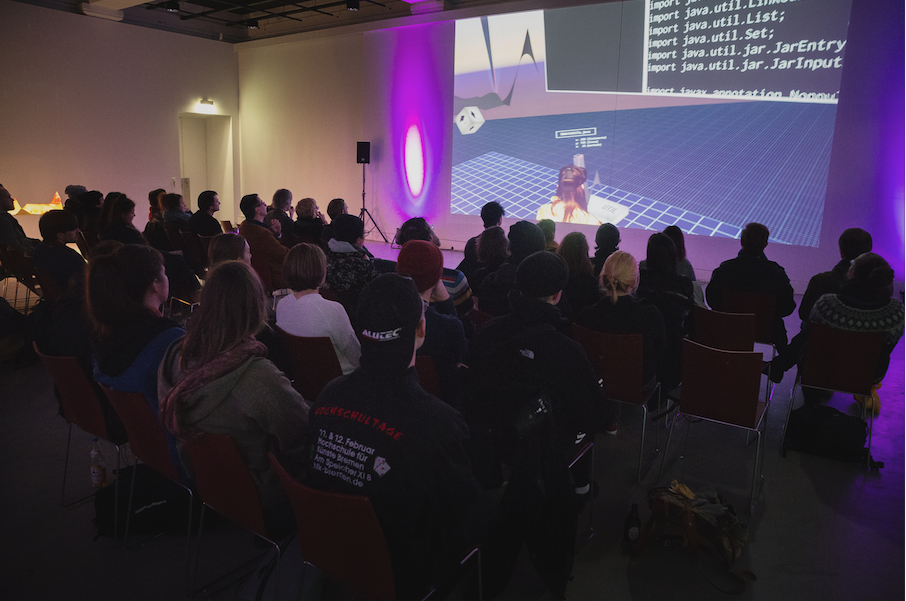
MA colloquium public presentation and exhibition, Gallery Dechanatstrasse, Bremen 2017.
License
This original work is copyright by University of Bremen.
Any software of this work is covered by the European Union Public Licence v1.2.
To view a copy of this license, visit
eur-lex.europa.eu.
The Thesis provided above (as PDF file) is licensed under Attribution-NonCommercial-NoDerivatives 4.0 International.
Any other assets (3D models, movies, documents, etc.) are covered by the
Creative Commons Attribution-NonCommercial-ShareAlike 4.0 International License.
To view a copy of this license, visit
creativecommons.org.
If you use any of the assets or software to produce a publication,
then you must give credit and put a reference in your publication.
If you would like to use our software in proprietary software,
you can obtain an exception from the above license (aka. dual licensing).
Please contact zach at cs.uni-bremen dot de.
