Balancing author and reader driven narrative structure in interactive data visualization
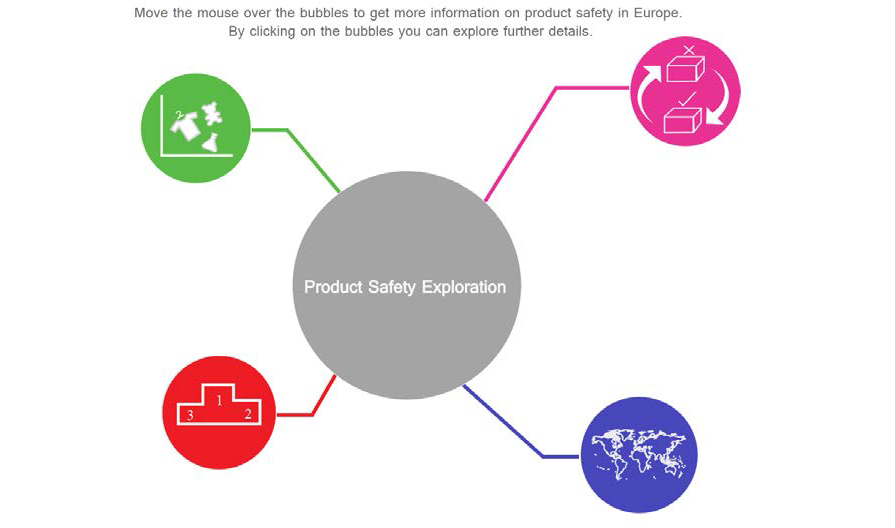
This study focuses on creating an interactive data visualization based on product safety annual reports between 2005 to 2013 in Europe. It uses different story telling techniques in order to evaluate more effective ways to present data. The goal of this study was to investigate the deeper levels of narrative structures and find out the best practices when the author tends to send a specific message to the user as well as give the user the opportunity to interact with the application freely and make personal conclusion.
Description
Ubiquitously available information has increased dramatically and has led to the quest of dealing with the threat of information overload. Understanding how humans process information and by what means we can leverage our natural strengths in this area is a key success factor for anyone who has something to communicate.Current state-of-the-art concepts that are analyzed and elaborated in detail in this study include methods like telling stories based on data using narrative structures and interactivity. Also interactive data visualizations play a relevant role in this field and promote information intake and learning processes with the audience.The specific question of interest that was examined with a user study is how different author- and reader-driven approaches influence how much information is understood and remembered by the audience.Users that were directed to the main areas of interest by providing them some questions upfront showed significantly better results in answering questions after the expo-sure to data than less guided users. This insight can be used to create even better suited visualizations for different purposes in the future.
Results
The result of the study showed that the group, which started the author-driven part of the application with the sets of questions, significantly per-formed better and had a better understanding compared to the group which had the video as the introduction part.
Files
Full version of the master thesis
Here is a movie that shows different slide shows of the web based application:
License
This original work is copyright by University of Bremen.
Any software of this work is covered by the European Union Public Licence v1.2.
To view a copy of this license, visit
eur-lex.europa.eu.
The Thesis provided above (as PDF file) is licensed under Attribution-NonCommercial-NoDerivatives 4.0 International![]()
![]()
![]()
![]() .
.
Any other assets (3D models, movies, documents, etc.) are covered by the
Creative Commons Attribution-NonCommercial-ShareAlike 4.0 International License.
To view a copy of this license, visit
creativecommons.org.
If you use any of the assets or software to produce a publication,
then you must give credit and put a reference in your publication.
If you would like to use our software in proprietary software,
you can obtain an exception from the above license (aka. dual licensing).
Please contact zach at cs.uni-bremen dot de.